Curve sketching step by step: domain, asymptotes, extrema and the graph
Type a function, and the solver works through a full analysis in the standard order: domain, symmetry, zeros, asymptotes, extrema, concavity and inflection points; then it builds a sign table and draws the graph with every point it found.
y = x^3 - 3x
y = x^2/(x - 1)
y = x e^(-x)
y = ln(x)/x
y = x/(x^2 + 1)
y = e^(-x^2)
y = sin x + cos x
y = cbrt(x)
Loading the solver…
What you can type
A function of one variable in any familiar form: y = x^3 - 3x, f(x) = x^2/(x - 1), x e^(-x), ln(x)/x, sqrt(4 - x^2), tan x. You can leave in words like “sketch the curve” or “analyse the function”: the solver skips them. Parameters such as $a$ in $y = ax^2$ must be replaced by numbers: the analysis depends on their values.
You can paste the formula too, from almost anywhere: LaTeX (\frac{x^2}{x-1}, with or without dollar signs), an equation from Word or Wikipedia, text with x² and ½, Wolfram (Log[x]/x), Python (np.exp(-x**2)), Excel (=POWER(A1,3)). The field turns it into the usual notation and shows it as a formula; the “TeX” button opens the source, to fix or copy. The functions you solve are kept in this browser (the “Mine” row), a star keeps the ones you need on top, and “Export” gives the solution as LaTeX for Overleaf, as Markdown, as text, as a picture of the graph, or for printing.
The plan of the analysis
A “full analysis” of a function has an established order, and it isn’t arbitrary: each step relies on the ones before it.
- The domain. Where the expression makes sense: denominators aren’t zero, what’s under an even root is non-negative, what’s under a logarithm is positive. Everything else depends on it: discontinuities, asymptotes, the intervals where the sign is constant.
- Symmetry and periodicity. If $f(-x) = f(x)$, the graph is symmetric about the $y$-axis; if $f(-x) = -f(x)$, about the origin. A periodic function only needs to be analysed over one period.
- Where it meets the axes. $f(0)$ is the point on the $y$-axis, and the roots of $f(x) = 0$ are on the $x$-axis.
- Discontinuities and vertical asymptotes. At the points left out of the domain, compute the one-sided limits. An infinite limit means a vertical asymptote; a finite one means a “hole” in the graph.
- Asymptotes at infinity. A line $y = kx + b$ that the graph hugs as $x \to \pm\infty$.
- The first derivative. Its zeros and the points where $f'$ doesn’t exist are the critical points. The sign of $f'$ on the intervals between them tells you where the function increases and decreases, and a change of sign gives maxima and minima.
- The second derivative. Its sign gives the concavity, and a change of sign gives the points of inflection.
- The table and the graph. All the points and signs you’ve found go into one table, and the graph is drawn from it: first the asymptotes, then the key points, then the curve, running between them the way the signs dictate.
Why the sign of the derivative tells you about growth
The link between the slope at each point and the behaviour over a whole interval is given by the mean value theorem (Lagrange’s theorem): on any interval there’s a point where the instantaneous rate equals the average rate.
The whole method follows from this. Inside an interval where the derivative doesn’t vanish or break, it keeps its sign, so checking one point is enough. If the function was increasing to the left of a critical point and is decreasing to the right, there’s a maximum there; the other way round, a minimum. If the sign doesn’t change, as for $y = x^3$ at zero, there’s no extremum, even though $f'(0) = 0$.
For asymptotes the reasoning goes like this. If the graph approaches the line $y = kx + b$, then the difference $f(x) - kx - b$ tends to zero. Dividing it by $x$ gives $\frac{f(x)}{x} \to k$; knowing $k$, we find $b = \lim (f(x) - kx)$. If either limit is infinite or doesn’t exist, there’s no oblique asymptote; if $k = 0$, the asymptote is horizontal.
A full analysis: $y = \dfrac{x^2}{x - 1}$
1–3. Domain, symmetry, zeros
The denominator mustn’t be zero: $x \ne 1$, so the domain is $D = (-\infty, 1) \cup (1, +\infty)$. The domain isn’t symmetric, so the function is neither even nor odd; there’s no trigonometry, so it isn’t periodic. $f(0) = 0$, and $x^2 = 0$ has no other roots: the graph passes through the origin.
4–5. Asymptotes
As $x \to 1^-$ the numerator is close to $1$ and the denominator is a small negative number, so $f \to -\infty$; as $x \to 1^+$ we get $+\infty$. The line $x = 1$ is a vertical asymptote.
At infinity: $k = \lim \frac{x^2}{x(x - 1)} = 1$ and $b = \lim\left(\frac{x^2}{x - 1} - x\right) = \lim \frac{x}{x - 1} = 1$. The oblique asymptote $y = x + 1$ is the same as $x \to +\infty$ and as $x \to -\infty$.
6. The first derivative
$$y' = \frac{2x(x - 1) - x^2}{(x - 1)^2} = \frac{x(x - 2)}{(x - 1)^2}.$$
The zeros of the derivative are $x = 0$ and $x = 2$; it also fails to exist at $x = 1$, but the function itself isn’t defined there. The denominator is a square and so positive, and the sign is set by the numerator $x(x - 2)$: “$+$” on $(-\infty, 0)$, “$-$” on $(0, 1)$ and $(1, 2)$, “$+$” on $(2, +\infty)$. At zero the sign changes from plus to minus, giving a maximum $f(0) = 0$; at two it changes from minus to plus, giving a minimum $f(2) = 4$.
7. The second derivative
$y'' = \frac{2}{(x - 1)^3}$. For $x < 1$ it is negative, so the graph is concave down; for $x > 1$ it is positive, so the graph is concave up. The sign changes only at $x = 1$, where the function doesn’t exist, so there are no points of inflection.
8. The table and the range
| $x$ | $f'$ | $f''$ | $f$ |
|---|---|---|---|
| $(-\infty, 0)$ | $+$ | $-$ | increasing, $\cap$ |
| $0$ | $0$ | max, $0$ | |
| $(0, 1)$ | $-$ | $-$ | decreasing, $\cap$ |
| $1$ | undefined, asymptote | ||
| $(1, 2)$ | $-$ | $+$ | decreasing, $\cup$ |
| $2$ | $0$ | min, $4$ | |
| $(2, +\infty)$ | $+$ | $+$ | increasing, $\cup$ |
The left branch rises from $-\infty$ to the maximum $0$ and falls back to $-\infty$ at the asymptote; the right branch comes down from $+\infty$ to the minimum $4$ and goes up along $y = x + 1$. So the range is $E = (-\infty, 0] \cup [4, +\infty)$: the function takes no values between $0$ and $4$.
A second example is shorter. For $y = x e^{-x}$ the domain is the whole line, $y' = e^{-x}(1 - x)$ gives a maximum at $\left(1, \frac1e\right)$, and $y'' = e^{-x}(x - 2)$ gives an inflection at $\left(2, \frac{2}{e^2}\right)$. As $x \to +\infty$ the exponential wins, and $y = 0$ is a horizontal asymptote; as $x \to -\infty$ the function goes to $-\infty$ faster than any straight line, so there’s no asymptote.
Common mistakes
- Intervals that run across a discontinuity. For $\frac{x^2}{x - 1}$ the function decreases not on $(0, 2)$ but on $(0, 1)$ and $(1, 2)$ separately: across the asymptote the function doesn’t “decrease”, it jumps from $-\infty$ to $+\infty$.
- A zero of the derivative isn’t yet an extremum. For $y = x^3$ the derivative $3x^2$ vanishes at $x = 0$, but the sign doesn’t change: it’s a point of inflection with a horizontal tangent.
- Forgetting the points where the derivative doesn’t exist. $y = |x|$ has a minimum at zero, even though $f'(0)$ doesn’t exist. Critical points are both the zeros of $f'$ and the points where it’s undefined.
- An inflection where $f'' = 0$ without a change of sign. For $y = x^4$ the second derivative $12x^2$ is zero at zero, but the graph is concave up everywhere.
- Looking only for horizontal asymptotes. If $\frac{f(x)}{x}$ tends to a non-zero number, the asymptote is oblique, like $y = x + 1$ above. And it’s looked for separately as $x \to +\infty$ and $x \to -\infty$: $e^{x}$ has a horizontal asymptote only on the left.
- Confusion over “convex” and “concave”. Different textbooks describe a cup-shaped graph as concave up, convex, or even “convex downwards”. The solver says the graph “bends up like a cup” ($f'' > 0$, $\cup$) or “bends down” ($f'' < 0$, $\cap$) and draws the symbol, so there’s no ambiguity.
See also
What a function is, domains, symmetry and monotonicity are in the chapter “Functions and graphs” (the sections on the domain, symmetry and monotonicity). Extrema, Fermat’s theorem and the mean value theorem are in the chapter on optimisation. Each step of the analysis can be checked separately: the derivative, the limits for the asymptotes, inequalities for the domain and the signs. To practise finding extrema, try the trainer.
Where this is explained
 9
Functions and graphs
Sometimes the answer to a question isn’t a number but a rule. Let’s play with machines that turn some numbers into others: learn to crack them from a few throws, see them whole in a single picture, tune them, chain them into a production line and run them in reverse.
 27
Extrema and optimization
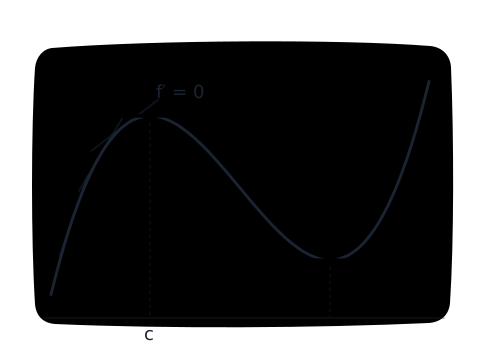
An inventors’ contest: a box from a sheet, a speed camera on a highway, a lifeguard on a beach, a tin can and the square root of two on a calculator with no square-root key. Each task has infinitely many options, and the derivative finds the best.
Other solvers
- Quadratic equation
- Linear equation
- System of linear equations
- Higher-degree equations and factoring
- Inequalities by the interval method
- Derivative
- Integral
- Limit
- Fraction arithmetic
- GCD, LCM and Euclid's algorithm
- Prime factorisation
- Solving a triangle
- Matrices: determinant, inverse, rank, eigenvalues
- Trigonometric equation
- Exponential and logarithmic equations
- Percentages, compound interest, loans
- Permutations and combinations
- Number bases
- Complex numbers
- Congruences
- Progressions
- Probability: Bayes and Bernoulli trials
- Differential equation