The waveform is the most familiar portrait of sound: audio editors, players and voice messages all draw it. Vertically it shows how far a microphone's diaphragm swings from rest; digitally, that is just numbers: 44,100 a second on a CD, which by the sampling theorem keeps every frequency up to 22 kHz, all that we can hear.
How it works
A three-minute track holds about eight million samples, while the picture has a few hundred bars. So each bar boils thousands of numbers down to three: the minimum, the maximum and the root mean square (RMS). Peaks show how far the wave reaches, RMS how loud it sounds to the ear. “Bars”, “rings” and “spiral” draw loudness from RMS; “envelope” draws pale peaks around a dense core.
The ratio of peak to RMS says a lot about a recording. Live acoustic music has plenty; loud modern masters squash it with compression, turning the waveform into a solid brick. In live mode the layer shows the last milliseconds of sound like an oscilloscope, triggered like a real one on a rising zero crossing, so a steadily sung note stands still.
A bit of history
The first machine to draw sound was Édouard-Léon Scott de Martinville's phonautograph (1857): a stylus tied to a diaphragm scratched the wave onto soot-blackened paper. They were never meant to be played, but in 2008 researchers digitised an 1860 phonautogram and heard the song “Au clair de la lune”, one of the oldest recordings of a human voice. Edison's phonograph, which could both record and play, came in 1877. The sampling theorem was proved by Vladimir Kotelnikov in 1933; in the West it bears the names of Nyquist and Shannon.
What to tweak
- “Style” “mirrored” stands the track on still water; “rings” and “spiral” with a few “Rings / turns” coil it into a record.
- “Colour” “by loudness” lights up the choruses and dims the quiet parts; “Smoothing” turns the picket fence into a silhouette.
- Put the waveform over a “Spectrogram” of the same track and loudness meets frequency on one poster. Being vector, it exports to SVG and prints at any size.
- Turn on the microphone and “live” mode: with “Window, ms” at 5–10 single periods of a voice show. Load a track or send one from the Studio with “Visualise in Patterns”: in “auto” mode the played part glows brighter, and a video with sound (“Download” → “Video” → “With sound”) shows it growing.
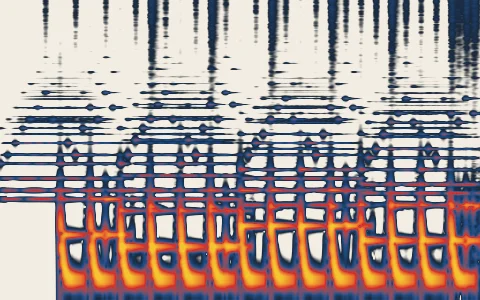 Spectrogram
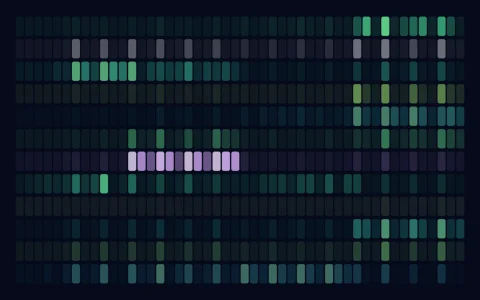 Chromagram
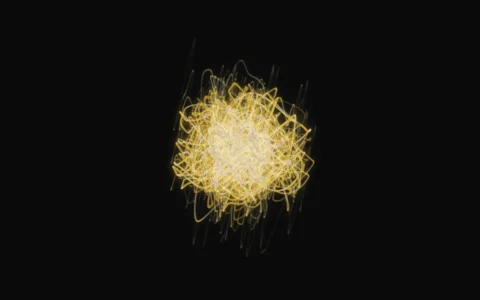 XY oscilloscope
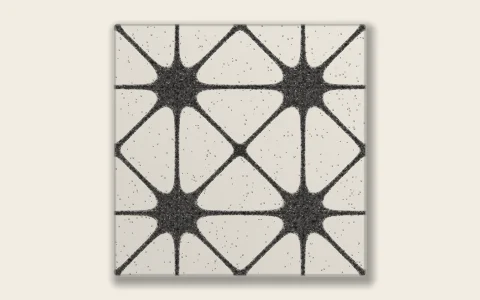 Chladni figures
 Faraday waves