Recolouring changes not the drawing but its colour language. That is how duotones are printed, how a thermal camera paints temperature and how astronomers colour invisible light. This effect translates the picture below into the document palette in three ways.
How it works
It starts with lightness — from OKLab, not RGB: a space where equal steps in number are roughly equal steps in perception (for a grey, L ≈ ∛Y, the cube root of luminance). It is then prepared as in Levels: “Auto levels” stretch its range using a sparse 9×9 scan, “Black point” and “White point” clip the ends, “Gamma” bends the middle and “Steps” cut it into bands — posterisation. (“Hue rotation” uses only gamma, steps and invert.)
“Gradient map” turns that number into a colour. The palette colours and the background are sorted by lightness and joined by a gradient, also in OKLab, so dark parts of the picture get the dark palette colours and blends never sink into the grey mud of RGB mixing. “Nearest colour” replaces each pixel with the closest document colour by OKLab distance. “Hue rotation” turns the hue in OKLCH and leaves lightness alone; in HSL the same turn would make dark blue a blazing yellow, since both have 50% “lightness” there. If the new colour falls outside sRGB, chroma is bisected down until it fits, keeping lightness and hue.
A bit of history
The idea predates computers: sepia and toned prints, two-colour printing. In Marilyn Diptych (1962) Andy Warhol reduced a photograph to a few flat areas and repainted them — posterisation and a gradient map by hand, through silkscreen. Scientific colour maps fared worse: the jet rainbow distorted data for years, until Borland and Taylor wrote “Rainbow Color Map (Still) Considered Harmful” in 2007 and the perceptually even viridis was made for matplotlib in 2015. Björn Ottosson published Oklab in 2020 to replace CIELAB (1976), in which blue drifts to purple as it loses chroma.
What to tweak
- “Gradient” set to “in order” ignores lightness and walks the palette like a scale — good for rainbows and heat maps.
- “Steps” of 3–5 give Warhol-style poster bands; with “Auto levels” on, the bands span the picture's full range.
- “Invert” gives a negative in palette colours: light areas get the dark colours.
- “Mix with original” at 0.3–0.5 is a gentle tint instead of a full swap.
- It works best on Topographic map, Reaction–diffusion and Mandelbrot and Julia, whose intricate lightness turns into clean levels; over a Spectrogram it makes a scientific heat map.
 Wallpaper symmetry
 Kaleidoscope
 Distort
 Mosaic
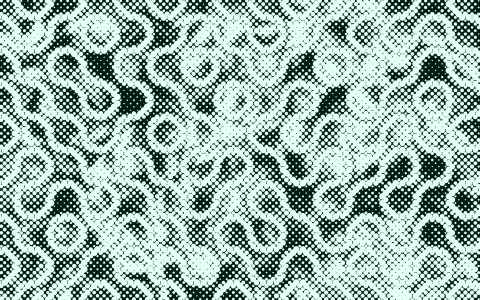 Halftone
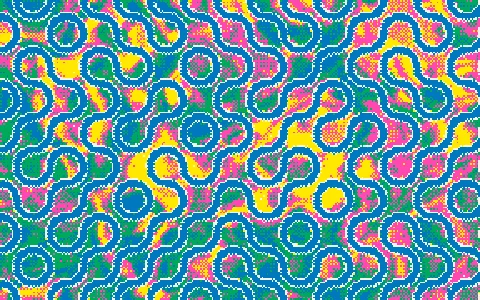 Dither
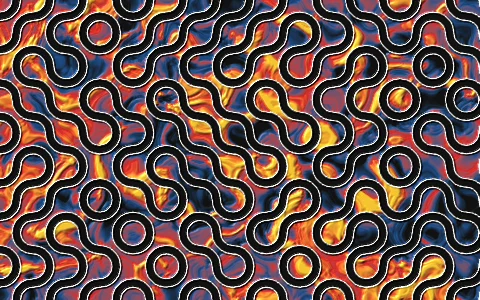 Relief
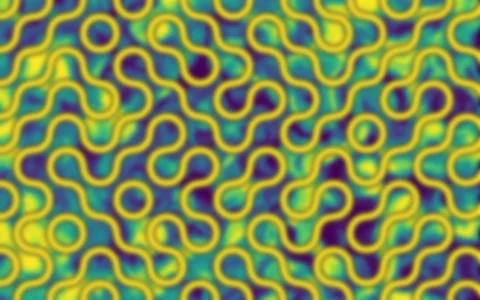 Blur
Blur
 Glow
Glow
 Grain
Grain
 Vignette
 RGB shift